Tag Archive | "Monitoring"

Microsoft System Center Upgrade To Monitor Private Clouds

Tags: BSM, Business Service Management, IT, Monitoring, Private Cloud, Service Portal


Business Service Management Commentary on IT Service Management, Service Level Management & Performance ManagementAt the recent Microsoft Management Summit, Microsoft released details of an upcoming upgrade to its System Center product that will let IT pros monitor private clouds from the System Center console. It’s significant because it increases Microsoft’s presence in the cloud monitoring space.

System Center currently is a made up of a series of products that let IT pros monitor the server infrastructure inside their organizations including a configuration manager, a virtual machine manager, data protection manager and so forth. There are two key pieces in the upgrade.

The first piece is called Advisor and according to Infoweek,  it monitors the system and collects data in Microsoft Azure. As the system builds a knowledge base of configuration information, it sends out alerts of potential trouble spots.

It’s important to note that this product is focused on a Windows Server environment, but for Microsoft shops, the new Advisor piece provides a way to monitor your server configuration in the private cloud and find trouble before it affects a large number of users.

The other piece is software for managing and deploying a self-service portal. If this sounds familiar, it should because recently we wrote about the Cisco purchase of newScale, a product that provides Cisco customers with the same ability to build a self-service portal.

It’s clear that the big players are getting into monitoring and private cloud provisioning in a big way, and that’s because there is a developing market for these tools as organizations look for ways to understand and build private clouds in-house and take advantage of the economies of scale that private cloud services can bring. Vendors like Microsoft and Cisco are clearly looking to build or purchase tools that meet these customer requirements.

Monitoring is a key provision of private cloud computing because it’s essential to have a big picture view across the entire organization’s infrastructure. While Microsoft’s solution is typically Microsoft-centric, it is interesting from a BSM perspective because it is about monitoring, deploying and understanding the IT infrastructure.

While many organizations will need more than a Microsoft-only approach, the fact that Microsoft is in the space, should be proof positive that it’s something every IT pro needs to be paying attention to, whether yours is a Microsoft shop or a more heterogeneous environment.

Photo by cote on Flickr. Used under Creative Commons License.

BSM Succeeds when…

Tags: Best Practices, BSM, Business Service Management, IT Management, IT Management Tools, Monitoring, Service Level


Business Service Management practices have the greatest chance of success when:

  • The solution provides several different views of the same data. The technical team needs a few different views (top down, bottom up, inside out), the end users of the systems (internal or external customers) want to see the services they are using along with the health (email, payroll, etc), management wants to see impacts to the business, revenue related metrics (trade volume).


  • Granular security control is needed to control the depth that end users are allowed to drill in as well as controlling which users are able to perform actions such as Acknowledging an alarm.  While the BSM solution must be able to represent the service from end to end, there rarely is a reason to have an executive drill down and look at the performance metrics of a network card on some obscure server.   Showing that a single node of a cluster is down is important to some users, this is useless data to others.


  • The solution fully understands health of the Service. Integrating with the JUST the top management tool may provide ‘all’ of the alerts within the environment, it won’t provide easy drill down into the underlying tool reporting the failure in order to get at additional details or command and control, it won’t tell you to fix Service A over Service B, it won’t tell you that if you do not reboot server123 in the next 10 minutes you will breach a critical Service Level.


  • Root cause is more than determining the router being down is the root cause of the server being unaccessible. While this is useful information, this type of root cause does not always map to why a Service is down.   Don’t get me wrong, it is very important and needed information.   The team responsible for resolving outages need quick answers, they need to be able to to quickly see within the sea or red alerts that this particular server being down is the reason that payroll is down.  Between this server and the 15 other outages, they might want to work on this server first… it’s payday.


  • The end users of the implementation are consulted with to understand their requirements. Just because you can set up the view one way doesn’t mean that it provides value to the end users.  They need easy access to the data, they need quick access to other internal tools (knowledge base, help desk, etc).  The solution needs to make their lives easier.


  • Start with an important Business Service, or a single important application or one that keeps the CTO up at night worrying about it.   If you start with mapping the one service end to end (as best as possible without getting stuck in a rabbit hole), get an internal win, ROI, etc., it helps map out the next Services, rally other teams to get involved, etc.   Trying to do every service end to end completely automated, etc is trying to boil the ocean, it’s not going to work.   Sometimes a partial view is better than no view.  Stating small and working out from there is key.


One other reason that I purposely omitted is management buy-in.   I feel that it is important, but to get started, it may not require complete management buy-in.   What I mean is, sometimes management buy in is only needed within your own group or department, other management buy-in is sometimes needed in order to expand the footprint or get additional details.   I’ve seen that come along as the BSM team gets wins under their belt.

Okay, don’t be shy, what are some reasons that Business Service Management worked for your organization (or you think you need for your planned BSM implementation to be successful)?   Dashboards, HA/DR, CMDB, Discovery, ITIL projects…

– Tobin


Microsoft Announces Mobile Management Tool for iPhone, Android & More

Tags: BSM, Business Service Management, Enterprise IT, Microsoft, Microsoft Management Summit, Mobile, Monitoring, System Center Configuration Manager 2012


Believe it or not Microsoft held a conference last week that was devoted completely to device management. Dubbed the Microsoft Management Summit (MMS), Microsoft looked at many ways to manage the variety of devices in your organization. 

They described it as follows on the event web page:

“At MMS 2011, you’ll drill deep into IT management technologies and learn about the latest solutions for Desktop, Datacenter, Device and Cloud management from Microsoft.”

Now, you might expect since it’s Microsoft that this was exclusively devoted to managing Windows devices — whether PCs, tablets or mobile phones — but you would be wrong. In fact, Microsoft announced the Beta of a new monitoring tool that they claim enables you to track iOS devices (both iPhones and iPads). Symbian (that’s Nokia’s OS for now until they switch over Windows Phone 7 next year) and Android.

It also lets you watch your servers and clients (although presumably these are Windows only).

The tool, The System Center Configuration Manager 2012 (SCCM 2012), will supposedly enable IT pros to manage this variety of devices from a central console. According to a post by Mary Jo Foley, Microsoft reporter  extrordinaire, on ZDNet, the new tool has been designed specifically to handle the so-called consumerization of IT, which has lead to the proliferation of a variety of mobile devices across the enterprise.

Microsoft released its second SCCM beta last week. From a monitoring stand-point, this is a big departure for Microsoft which typically confines its monitoring to Windows devices. While Foley suggests this undercuts Microsoft’s claim that Windows tablets are superior to iPads and Android tablets, I think it shows surprising foresight to acknowledge the breadth of the existing market and to provide a way to monitor all of the mobile devices in the organization.

Foley pointed out, however, in an update that the SCCM 2012 actually results in a weaker mobile reporting product in spite of the fact it’s supporting these additional devices. That’s because Foley’s colleague, Simon Bisson, reported that Microsoft has decided to moth ball the System Center Mobile Device Manager (SCMDM), which while supporting fewer devices than SCCM 2012, provided a more detailed view of those devices it supported.

Regardless, it show that with a Summit devoted entirely to monitoring, it is a critical part of IT’s job. Look for another post or two later this week on news from last week’s Summit.

Top Reasons We Have Not Reached SLA Nirvana – Yet

Tags: Availability, Business Service Management, IT Management Tools, Monitoring, Performance, Service Level


Why aren’t we at Service Level Agreement (SLA) nirvana?  I mean really, we have had SLA tools for 10, 15 years or more.  You probably have 1 or 10 or more tools that measure SLAs, of which most probably aren’t used.  Why aren’t all of our data centers, applications, servers and everything else just numbers on some dashboard that we just glance at to make sure everything is good to go and that we are open for business?  This troubled me so I decided to make a list of some of the possible reasons:

1.  Too many different tools, specialties and areas of focus

You have tools the measure SLAs for the network, different ones for the infrastructure, different ones for virtual machines, different ones for the cloud, and the list goes on and on.  I think this is one of the biggest issues with SLA reporting.  Who wants to look at 3 – 10 different tools to know if they are passing all of their SLAs?  Or who wants to maintain integration into all of those tools to then pull all of that data into one dashboard?  And then what do you do if someone wants to see historical data?  This becomes a very deep and very big hole. So then companies move on to my number 2 reason.

2.  SLA monitoring via trouble tickets

Wow, this is great.  Finally one source for all of our SLA data.  All we have to do is make sure every issue we have gets opened as an issue in our help desk tool.  Right!  The issue eventually happens that you missed an outage and that outage caused you to violate your SLA.  Then the logic pervades the company something like: ‘If our tool missed that SLA, what else is it missing?’  And eventually: ‘We just can’t trust this tool’ or ‘We just can’t trust our monitoring’ etc.  Also, this is dependant on someone putting in the correct data and time.  Not to say they would purposely fudge the numbers but how long would you say something was down that you were responsible for?

3.  SLA status based on Network availability

Ok, we have all been guilty of it.  If you have ever had to guarantee 5 9’s availability, you reported on just the network availability.  Why?  Because you had the data, your data met what was expected ( 5 9’s ) and you could easily report on it.  Did that meet the intention of the SLA?  No, but (insert your excuse here).  When someone that cares about an SLA defines it as 99.999% availability, they truly want to be able to access the application or business function 99.999% of the time not just the network.  This is discussed further in item 5.

4.  Can’t get the data.

Sometimes we just can’t get at the data that we would need in an automated fashion to allow us to have an SLA  defined.  This may be due to  political or technical issues, I am sure you have seen both.  This must be resolved with either the customer pushing for it or someone pushing for the customer.  In the IT world we live in today, virtually all data is accessible with permission and ingenuity.

5.  Technical vs business data

This one is also very common.  You report you are meeting your SLA of 99.999% up time and the customer says, ‘but it is never available when I need to use it.’  Been there?  Why is this?  Because you are reporting that all of the things that you are responsible for technically, are available.  But when the customer goes to use the application or business service, some piece that he uses and you might not be responsible for isn’t functioning or responding in a timely manner, etc.  Does this make your SLA data wrong?  Yes, from a customer perspective (and does anything else really matter?).  Your SLA must be looked at from the business point of view as much as possible.  Now, you won’t be able to take into account the customer’s home network being down and then having that blamed on you, but if you have enough data showing the service was available from a business point of view, you will be able to push back on them.

What do I mean about monitoring the SLA from a business point of view?  Well, it means a few things and these will change depending on how your customer uses the service.  Through put, response time, transactions processed per time period, synthetic transaction, functional status of all single points of failure for the service.

6.  Data is too bad

When you do get everything monitored and all of the data in one source, sometimes the data is just too bad.  Instead of 5 9’s, you’re showing 5 7’s.  So instead of showing this to the customer or management instead you (insert your excuse here).  This issue can be overcome by either going into the underlying tools and fixing the monitoring to only report outages when they are outages or by fixing your applications and infrastructure.

7.  SLA’s just a punishment tool

I have seen this in many different companies.  You struggle to meet the SLAs and whenever you miss, here comes the stick.  This will then motivate you to either fix the issues or quit reporting.  Too often I have seen the later.  This doesn’t have to be.  Used correctly SLAs can be a carrot and a stick. They can allow you to qualify exactly what is part of the SLA and what hours you are responsible to meet the SLA, thereby reducing/eliminating penalties for off hours and devices that aren’t part of the service or not in you control and then allow you to better meet the SLA for the true service times.  SLAs need to have the carrot to be managed effectively.

As we have remained in a reactive mode for many years, now is the time to turn that around into proactive and aligning with the objectives of the business.  In the next post we’ll talk about how you turn this around and stitch together a successful Service Level strategy.

What would you add to this list of challenges?

Lee Frazier
Thinking About Early Warnings

Tags: BSM, Business Service Management, IT, Monitoring, Prevention


The recent earthquakes in New Zealand got me thinking about early warnings. A CIO.com article suggested that computerized early-warning signals might help warn people of impending disasters like the one that happened in February. What do earthquakes have to do with IT? Well, you might need early warning systems too before disaster strikes your system. 

In the CIO.com article, researchers were talking about warnings measured in seconds, but suppose you had the power to stop your network disaster long before it happened? A good monitoring system can give you that power. It may not save lives as the earthquake systems have the potential to do, but it could save your company money and you and your colleagues loads of frustration and aggravation.

Earthquakes leave death and devastation in their wake. I don’t mean to equate human misery on that scale with a computer outage, yet when systems go down it still can affect many people depending on its scope. If a service like Gmail goes down it could have an impact on millions of people.

When your mission critical systems go down, it can have a profound impact on productivity and that translates into actual dollars and cents measured in hours of lost productivity. If your web site goes down and you rely it on for ecommerce purposes, you can equate it with actual lost dollars

Regardless of how you measure it or look at it, if you could prevent a systems disaster  most companies would do it. And when you have good measuring systems in place and tuned correctly to measure how well your systems are running, you have at least the potential to help troubleshoot and prevent long term outages on your system before they cause problems.

It is certainly not on the scale of an earthquake, but you can implement your own early warning systems before disaster strikes your systems.

Photo by Rhys’s Piece Is on Flickr. Used under Creative Commons License.

VMware brings virtual machine monitoring to iPad

Tags: AppStore, BSM, Business Service Management, iPad, Monitoring, VMware, VMware vSphere, Windows Intune


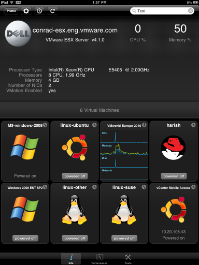
VMware has introduced a new iPad app for IT professionals that enables you to monitor your virtual machines from the iPad. The vSphere Client app was approved and available in the Apple App Store as of March 18th.

This tool brings monitoring to mobile devices. While some tools like Windows Intune let you access the monitoring console from a mobile browser, VMware built an app from the ground up to give IT professionals access to the virtual machines they monitor from wherever they are from the iPad..

You can monitor performance, keep an eye on your host servers and all of the virtual machines associated with those servers in a visually attractive, easy-to-manipulate interface.

The way it works is you download the app, log into your VMware account and you get access to all of the servers under your watch. You click a server and you can see the all of the virtual machines running on it. It even provides little icons like Windows and Red Hat to let you know which virtual machines are running a particular operating system. You can see a shot of this screen below:

Once you have a server displayed you can put it in maintenance mode or even reboot it remotely from your iPad if need be.

Clicking on a particular virtual machine displays a screen with information about that virtual machine such as recent events, and each virtual machine has controls like the server that let you suspend, stop or restart it as needed.

What’s more you can see the amount of memory and CPU that the chosen virtual machine is using from the server as a whole.

We like to show many examples of different types of monitoring on this blog, and this new tool from VMware brings virtual machine monitoring to a new level. It might not be as comprehensive as the tools you have access from your PC, but it provides a lot of good information to help you manage and understand your virtual machine environment from an iPad and from a monitoring perspective, that’s pretty exciting stuff.

Screenshot courtesy of VMware.

Enhanced by Zemanta

Monitoring the Internet in Japan After The Disaster

Tags: Disasters, Internet, Japan, Keynote Systems, Monitoring


At a time when the Internet remains perhaps the most critical communications channel for the people devastated by the earthquake and tsunami last week, remarkably it has continued to operate in spite of the dismal conditions on the ground throughout much of the country.

Keynote Systems, an Internet monitoring company that has been watching the health of the Internet inside Japan after the disaster struck found that the Internet continued to run in spite of a the level of destruction across Japan.

Dave Karow, senior product manager for Internet testing and monitoring at Keynote said over the weekend, “At a macro level, the Internet did what it’s supposed to do. It didn’t even blink. Access from Tokyo to major internet properties based on the Keynote Business 40 was not impacted in any meaningful way. Additionally, access between Tokyo and regional hubs including Seoul, Singapore and Taipai, as well as San Francisco, was not impacted either.” That’s pretty amazing when you consider some of the video that was coming out of Japan on Friday.

Further updates from Keynote indicated there were some problems on Monday, but certainly less than you would expect given the situation. The latest update also included status message from NTT, Japan’s main internet backbone provider that submarine repair crews were on the way to repair damaged undersea cables.

You can view Keynote’s online Internet monitoring tool here. It’s a very interesting look at the health of the Internet backbone across the world.

As Steven J. Vaughan-Nichols writing on ZDNet pointed out, it may seem low on the scale of priorities after a disaster of this proportion, but the fact that people can access the Internet means they can get news, communicate and try to find the whereabouts of loved ones, so in a sense it is extremely critical that the Internet has continued to run as a key communications channel for those affected by the disaster.

Tools like Keynote’s can help us understand the situation and get details about the state of the Internet when it is so crucial that these channels remain open.

Photo by Silveira Netto on Flickr. Used under Creative Commons License.

Monitoring the Japan Earthquake and Tsunami

Tags: BSM, Disasters, Monitoring


The speed at which the earthquake and tsunami hit Japan last Friday, and the devastation they left in their wake was shocking and horrific. Technology and how we use it, without a doubt seems insignificant against such a back-drop, yet it’s worth mentioning there were monitors in place during this horrible event and they played a key role in early warnings for other countries, and for building our body of knowledge ahead of future earthquakes and tsunamis.

Wayne Rash writing in eWeek described the Tsunami monitoring system located throughout the Pacific Rim. He explained that there are two types of monitors, buoys that record tsunami activity as it rolls over them and another set of monitors attached to piers and other coastal structures that Rash explained measures the severity of the Tsunami as it begins to hit shore. He describes it as follows:

Each of these buoys, located mostly around the highly seismically active Pacific Rim (also known as the “Ring of Fire”), reports the signs of a tsunami as it passes. Once this data is gathered and processed at the tsunami-warning centers in Hawaii and elsewhere, it delivers a nearly instantaneous, real-time picture of the speed, direction and severity of a tsunami.

As the waves arrive, they trigger a device called a tide station. These perform a similar function to the DART buoys, but they are attached to piers and other coastal structures, and measure the actual severity of the tsunamis as they arrive from the open ocean.

You can see from this video (which was likely generated using this monitoring equipment) just how much of the Pacific basin was affected:
In the end, the fact that monitoring was in place might have helped in some small way, as the tsunami rushed across the ocean and gave coastal authorities a warning, they might not have otherwise had. While monitors couldn’t stop the waves, they could at least do their job and provide warnings and data to build a higher level of scientific understanding for the future.

BSM could help resolve VDI network challenges

Tags: BSM, Business Service Management, Enterprise IT, Monitoring, Networking, VDI


Virtual Desktop Infrastructure (VDI) provides many advantages for IT by removing a number of the variables involved in managing individual networked PCs. When you give end users what is essentially a dumb terminal with a set of defined services, it can be easier to control and maintain, but it can also present challenges across a network because the entire system is dependent on the network with nothing offloaded to the individual machines (as with stand-alone networked PCs).

According to a recent post by David Greenfield on Network Computing, this is even more pronounced when you spread out from a LAN environment to a WAN. He cited several studies that use a variety of formulas to determine just how much bandwidth is required for each user across the network (before you start hearing loud complaints about network performance).

He writes:

A good rule of thumb when running PCoIP is three users per 1Mb. This allows for variance in the display activity between multiple users and provides a range of bandwidth most likely to provide acceptable performance for user.

Whether you buy that or not, it’s a number that you can work with as a basis for discussion if nothing else. If you figure that you require this much bandwidth, you can start to set your monitoring equipment to let you know when the system starts to degrade below these levels (before it reaches a critical state and your IT help desk is bombarded with angry phone calls).

For end users, a sudden slow-down might seem like a front end service issue, when in fact, the problem is the underlying network or a database processing problem. Having BSM monitoring in place can not only help you ensure (to the extent it’s within your control) that the network throughput is operating at the maximum rate possible, but you can also determine if one of the underlying hardware or database connectors on which these services depend is what’s causing the problem.

With BSM in place, you can watch the entire system, and that can help you solve your VDI problems before they reach a point where it adversely affects your user base.

Photo by olishaw on Flickr. Used under Creative Commons License.

Your Service Costs What?! Justifying Internal Chargebacks

Tags: Business Service Management, Chargebacks, Cloud, Monitoring, Private Cloud, Utility Computing


I remember when I first started working for a consulting firm back in the 80s, how surprised I was to find that departments inside a company charged one another for services rendered. Today, as IT moves to internal or private cloud environments, you are setting up a series of internal services, for which you charge back based on usage, and you better be prepared to justify those costs to your internal customers. 

In some ways, charging for private cloud services is infinitely more fair than in the client-server model where everyone might have divided the cost equally even if one department was using the server more than another. With a private cloud, it becomes more like a utility bill, where you pay for what you use.

But as I learned in my first work experience, when you charge for a service, you may find that people can find a cheaper alternative elsewhere outside the company, so you have to be able to justify your costs. The copy center was a good example. Consultants could use the in-house service, or they could go to another copy center (if company policy allowed this).

We liked to think we provided a unique service. We worked beyond regular business hours and we boxed and shipped the items, sometimes at the last minute under great time pressure. Sure, they might find it cheaper at another copy center, but those people wouldn’t necessarily put up with their unreasonable demands.

But as costs tighten for everyone, being able to provide a service you can trust in-house for a reasonable cost based on understandable and measurable terms, becomes even more important than it was back in the 80s when I started my job. That means making sure your services are easy to access and use and guaranteeing certain service levels.

You can ensure that your systems and services are up and running by providing your IT department with solid monitoring tools that provide real metrics about up time. This can work in two ways. First of all, it lets your IT staff know when something isn’t working so they can react and fix it immediately.

Secondly, it gives you metrics that you can share with your internal customers to let them know in a fully open and transparent way just how often you are up (or down as the case may be). When you have solid data about the health and well being of your whole system, you can better justify the cost of the services you offer through that system, leaving you with a group of customers who might not always like the cost of the services, but at least understand what it is they’re paying for and why.

Photo by alanclever_2000 on Flickr. Used under the Creative Commons License.

Outages Can Wreak Havoc on Productivity

Tags: Availability, Business Service Management, Gmail, Intuit, IT, Monitoring, Networking, Outages, Skype


In September, 2009 Gmail went down for two hours. To hear the complaining on social networks like Twitter at the time, you would have thought the entire world had come to a stand-still, but for many people it did. That’s because this service meant more to them than just a nice-to-have free service. People had actually come to depend on it to communicate for business and personal means. 

Other high profile outages have followed including the Intuit outage last June and the Skype outage in December. These two outages lasted more than a day, leaving many unhappy users in their wakes and providing a snapshot for you of what happens when your systems go down.

People who need these services to do their jobs are left looking for work-arounds that IT might not ultimately be happy with (like using unauthorized services to try and get something done).

The fact is that as you sit there looking at your monitoring dashboard, there are real people behind those red lights trying get their work done, and these stories illustrate in a very concrete fashion that when services go down–whether it’s a public service or a private one– it can have a profound impact on actual users.  It can be easy to forget that as you look at the data in front of you on monitors, but it’s important to keep in mind that it’s not just some abstract representation of the service levels inside your company.

In fact, for every red light you see on the dashboard, is another person unable to complete a task using that service and the more mission critical it is, the bigger the effect.

So as you monitor your systems, and review your data and watch the activity streaming through your equipment, always remember that there are humans who depend on these tools to do their jobs, and when a service goes down, even for a little while, it can have major ramifications.

Photo by nan palmero on Flickr. Used under Creative Commons License

Cloud Control: Staying on top of a Hybrid Cloud

Tags: Cloud, Hybrid Cloud, Monitoring, Private Cloud, Public Cloud


Just last week, IDC released a report on the growth of cloud management software over the next several years. A Computerworld article discussing the report said these results highlight the importance of having a solution in place to monitor a hybrid cloud environment.

The hybrid cloud refers to a set of services that encompasses both public cloud solutions from companies like Amazon S3, Salesforce.com and Verizon, as well as private clouds built in-house behind the firewall.  According to IDC, in fact, by 2015, the cloud management software market will grow to $2.5 billion.

According to the Computerworld article, this software will include:

“…virtualization management, automated provisioning, self serve provisioning portals, dynamic consumption based metering and capacity analysis, service catalogs, end-to-end real time performance monitoring and related management software tools deployed into public and private cloud environments.”

As an IT pro, you need to be thinking about how this will affect your own company moving forward. Of course, this will involve deciding which services are better kept in-house and which are best out-sourced to the public cloud. Many factors will come into play when making these decisions including cost versus security considerations.

Regardless, being able to find ways to monitor the entire cloud environment both internally, and to the extent possible, externally, will be increasingly important as you move forward. One consideration you might want to take into account when choosing an external cloud vendor is the extent to which it provides information for your monitoring systems.

Some like Amazon S3, for instance, provide data you can use in your monitoring tools to measure and understand up time and other key metrics. You will want to take into account how easily you can independently monitor your external cloud services because chances are you will be judged by your internal customers based on your ability to understand and control the entire system–whether it’s internal or external.  Finding tools and vendors that give you the ability to understand the whole picture will be increasingly important as you make the transition to cloud services.

Photo by Lars Ploughman on Flickr. Used under the Creative Commons License.

Back to the Future – Monitoring 1999 Style

Tags: Business Service Management, IT Management Tools, Monitoring, Service Level


Tonight we’re gonna manage like it’s 1999.  I was introduced to a prospect today that made me feel like I was in a timewarp.  I was given of of those old school 400 question RFPs  which called for in-depth answers about Event Management – and I mean everything about it, correlation, rules, weighting, etc.  I had two reactions: isn’t this a “done” topic? Hasn’t Netcool been doing this so long that IBM bought them years ago to replace that dreadful T/EC? Couldn’t you have used the time and resources to put together this treatise to just download open source Zenoss and give it a try?

I know I shouldn’t be snarky about customers, but imagine you are a car dealer and someone comes in and wants to know every minute detail about the workings of a seatbelt. Wouldn’t you say “it’s a seatbelt, you click it and it holds you in”?  My next reaction was, “what does this have to do with Business Service Management (BSM)?” and the answer I got was “well, we want the events to be on a dashboard, that’s the BSM part”.  So now BSM = webpage front end?

We asked about managing from a business perspective, for example, if they are an insurance company perhaps managing the availability of claims processing, as opposed to servers and network segments and then spoke of setting service levels based on the business process as opposed to a server being up 99.xxx% of the time?  Actually, my point is that many of us that live and breathe BSM take if for granted that IT shops are up-to-date simply because we strive to stay ahead of the curve with BSM.

Here’s a quick definition, courtesy of Wikipedia.  “Business service management (BSM) is a methodology for monitoring and measuring information technology (IT) services from a business perspective; in other words, BSM is a set of management software tools, processes and methods to manage a data center via a business-centered approach.” Oh, and here’s a link to download open source Zenoss for monitoring, it might save you from having to write a 400 question monitoring rfp:  http://community.zenoss.org/community/download

I find more and more customers taking advantage of the open source technologies and consolidating at the monitoring level to remove costs in order to invest in the business service view.  The dynamic and distributed nature of the environment makes it nearly impossible to understand the monitoring events in terms of business impact without technology to map and present it as a single-pane-of-glass view.

I hope you enjoy my little humor for the week.

Phil

How Mgmt Tech will Fulfill Cloud & Virtualization Promises – NetworkWorld

Tags: Business Service Management, Integration, IT Management Tools, Monitoring, NetworkWorld, Performance, Trends


Being that we’re at the start of a new year and all, I thought I’d launch the 2011 newsletter by sharing predictions from a variety of network and systems management vendor executives.  (read more…)

BSM Stories from the Trenches-Hurricanes, Availability & Power On!

Tags: Availability, Business Service Management, Monitoring


Tale of Customer Service, Cost of Service Impact, Speed to Restore and the “Charley” View!

As we are in the heart of Hurricane season, I’m reminded of the old “Charley” Business Service View – a Category 4 Hurricane in 2004. This is a true story about a power company and how IT is impacted and how IT, by being proactive and hurricane prepared, can be the business driver in containing and managing the impending events that a hurricane brings with the loss of power due to downed lines. This is the second in a series of Business Service Management (BSM) Stories from the Trenches that I’ll post describing the benefits of a single-pane-of-glass and the management of complex infrastructures as services to the business and the customer driving customer satisfaction, revenue and growth.

The Set-up . . . . .

Just 22 hours after Tropical Storm Bonnie hit, Charley struck as a Category 4 Hurricane making it the first time in history that 2 tropical cyclones struck the same state in a 24 hour period. While the power companies have a bit of time to prepare for storms, managing the 2004 season was a tough one. So what is relevant to the power companies and what does IT have to do with the delivery of electricity:

* >3 million power consumers in the region
* Customer service applications become key
* Responding to customer complaints and logging them
* Using the customer calls to identify all outages
* “Keeping the Lights On” in the customer response center becomes key
* Dispatch systems are operationally key
* Returning service to customers in a time of need relies on IT doing more than just “Keeping the Lights On”

The Solution . . . . .

We need to know what to work on first in a “sea of red”and we know that due to power issues we will be inundated with network and systems management events. Managing those key customer and operational systems will take on a higher priority than anything else. This requires 4 things:

* Identify key customer and operational services in adverse situations
* Filtering of the intelligent service model to focus on newly prioritized services
* “Live”, single-pane-of-glass prioritizing events automatically
* Proactive service view to manage key systems averting downtime

We have monitoring in place, but we do not have a way to pull it together and marry it in a meaningful way to the infrastructure and we need to create a Service View of the infrastructure. This will require a lot of integration to meet the “live” requirement so that we can take action in real time and avert service impacting events, to filter the view to changing conditions and prioritize events.

This is where Novell’s Business Service Management came in to integrate, build the intelligent service models, automate the filtering of services, prioritization of events and the “Charley” dashboard that drove the delivery of high quality service of key customer and operational services.

The Benefits . . . . .

* >500,000 customers lost power
* >6,000 crews were dispatched successfully
* <1 week, 98% power restoration
* Exceeded the committed goal of 10 days for power restoration

IT does not restore the power and IT is impacted by the loss of power, but IT is critical in delivering the services that enable those to restore the power by connecting customers and line crews. The Intelligent Service Model and the automation of filtering services and prioritizing events ensures that systems are available that aid in power restoration. This is not an uncommon story for customers of the Novell Business Service Management solution. The heart of solution is the “live” integration and the intelligent service model making sense and relating bits of disparate data as super objects with rules describing conditions and state enabling operational teams to service align, mitigate risk and deliver mission critical services with consistent high quality driving the business.

I often run into IT folks that do not believe IT is critical to the organization. I find that is because they have not invested in understanding and aligning to the business objectives. Electricity is commodity, however, IT is key to driving revenue in getting power flowing again and the restoration of service in a time of need and adversity. Ask yourself what your company delivers to the public and how IT impacts driving the services that support that revenue and you have your answer as this power company did in determining where to focus and how that focus changes due to conditions. Are you agile enough to monitor, manage and measure to changes in real-time?

When Mission Critical Services is All About — “Keeping the Lights On”!

Check out this article of yet another energy company, again containing & mitigating risk: An Integrated Utility Network